I thought I’d write something about a few of the topics we discussed last week during Stargazing Live. First up: the spiral structure of the Milky Way galaxy which we discussed in episode 3.
The Milky Way
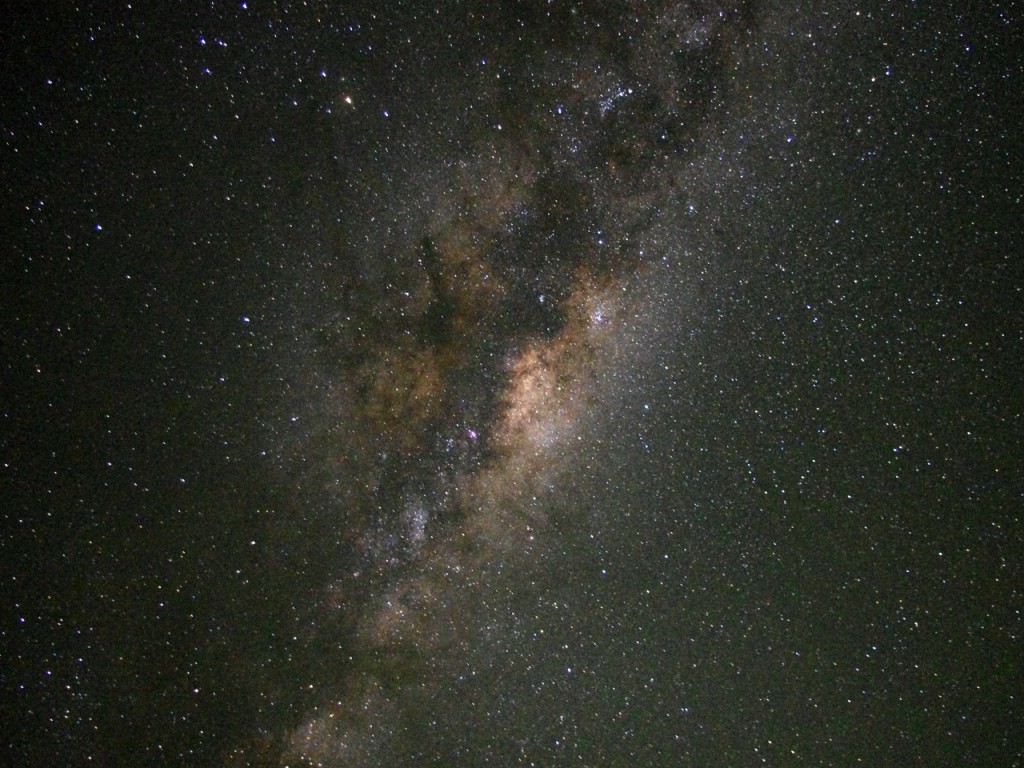
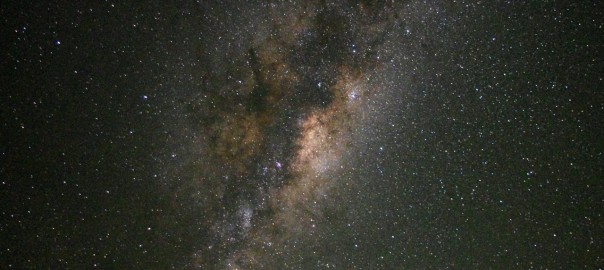
The Milky Way galaxy is made up of several hundred billion stars plus gas, dust and dark matter, all held together by their mutual gravitational attraction. The stars, gas and dust are found mostly in a disc – like two Frisbees 100,000 light years across stuck face to face. The Sun lies in the disc about two thirds of the way from the middle. From the Earth we see this disc side-on so it appears in the night sky as a band of hazy light stretching from horizon to horizon and threaded by dark dust lanes.

Usually the closer objects are to us, the easier they are to study. We can see more detail as they appear larger and we can detect fainter features in the light we collect from them with our telescopes.
However, although individual stars and nebulae may be easier to study in the Milky Way than in other galaxies, the overall structure of the Milky Way is very hard to discern. We are seeing it from the inside so it’s not possible to see it as a whole as it is for other galaxies. In particular we can’t easily see its spiral structure.
The 21-cm hydrogen line
On the Stargazing Live show we featured live observations from our 7-metre telescope (actually a misnomer since its actual diameter is 21 foot or 6.4 metres). This telescope, like our 42-foot pulsar monitoring telescope, is an ex-missile tracking dish from Woomera in Australia. Data collection is overseen by Christine Jordan at Jodrell Bank.
This timelapse video shows a day in the life of the 7-metre telescope. The Lovell Telescope and 42-foot telescope can be seen in the background.
The 7-metre is fitted with a receiver designed to pick up radio emissions from hydrogen atoms in interstellar space which occur at a wavelength of 21 centimetres. The famous 21-centimetre line (or simply the hydrogen line) is produced as a result of the change in energy level when the spins of the proton and electron in a hydrogen atom relax back to a low-energy configuration in which they point in opposite directions. This transition only happens every few million years for an individual atom, but there are so many atoms in space it is easily detected.
The existence of this line was predicted during World War II by Hendrik van de Hulst at Leiden Observatory in the Netherlands following a request from the Observatory Director Jan Oort (of Oort Cloud fame). It was detected in 1951 by Ewen & Purcell at Harvard University in the USA.
Radio astronomy was a brand new science in the 1940’s and Oort had recognised the fundamental importance of a spectral line (one in which the radio waves are produced with a very specific wavelength). In this case, any difference between the wavelength of the line received by our telescopes and the wavelength at which it should be emitted indicates a Doppler shift produced when the hydrogen atoms are moving relative to the telescope. Measuring this difference in wavelength immediately tells us the relative speed. Combined with the fact that radio waves travel more easily through interstellar dust, this gives a powerful way of studying the distribution and motion of the hydrogen gas clouds in the Milky Way and other galaxies.
Observations of the hydrogen line with radio telescopes in the Netherlands and Australia produced maps of our Milky Way revealing that the hydrogen clouds were distributed in arms with an apparent spiral structure.
Data from our 7-metre telescope
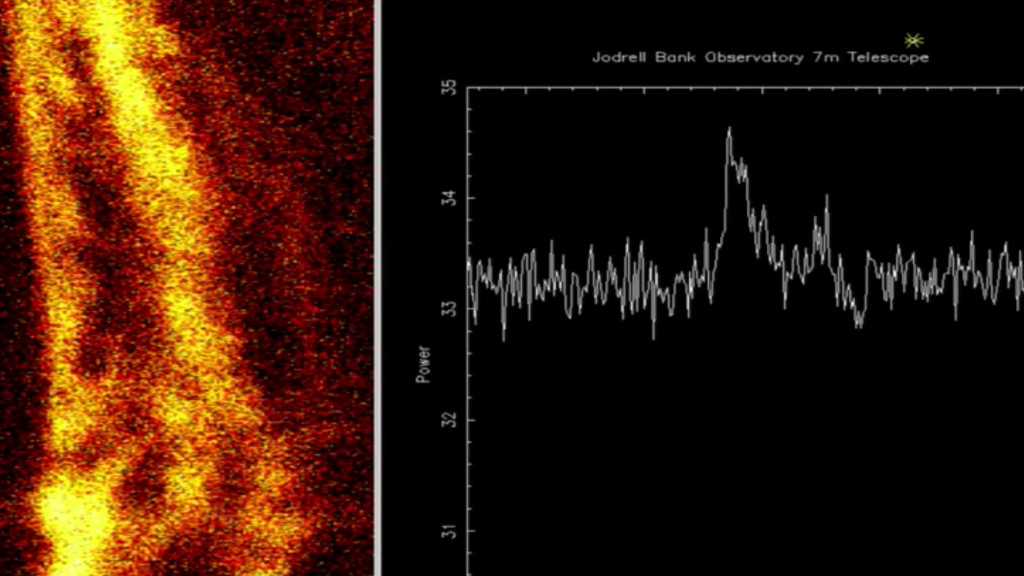
In the programme we showed a live spectrum of the hydrogen line pointing at a position with galactic longitude 132 degrees and latitude 0 degrees. The longitude is the angle around the disc (with zero towards the galactic centre) and the latitude is the angle above or below the disc – 0 degrees is pointing directly through the plane of the Milky Way. The spectrum is a plot of brightness versus frequency in the radio spectrum on the horizontal axis. It showed two peaks, a clear main peak and a fainter one just to its right. Since we were updating the spectrum in real time and using a relatively small telescope with room temperature receivers, the signal to noise wasn’t high – but this did emphasise the live nature of the observation.

Each peak in the spectrum is from a cloud of hydrogen somewhere along the line of sight of the telescope. If these clouds are moving at different speeds relative to us then they are Doppler shifted to different frequencies and so they appear at different points in the spectrum.

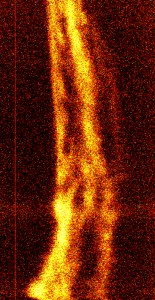
Alongside the live spectrum I showed some data I‘d collected earlier. This was in the form of a “waterfall plot” where the horizontal axis is frequency (as in the live spectrum) but the brightness is now represented by colour. Each horizontal line in the waterfall plot is then a spectrum from a slightly different position on the sky. The image was made by driving the telescope across the sky along the plane of the Milky Way. In this case I collected data from a galactic longitude of 50 degrees through to about 165 degrees whilst holding the galactic latitude at 0.
What you see in the waterfall plot is a series of vertical bands or ridges of enhanced brightness. Each of these ridges is a separate spiral arm marked by an increase in the density of interstellar hydrogen gas and hence its brightness. Since the stars and gas in the galactic disc are rotating, as we point the telescope in different directions through the disc the relative velocity of the gas changes and the ridges/arms meander from side to side across the waterfall plot. Some arms do not extend all the way round the disc and so are not visible at all galactic longitudes.
Debate on spiral structure
We mentioned in the programme that the spiral structure of the Milky Way is still debated. In 2008 it was suggested from observations of old stars with the Spitzer Space Telescope that the Galaxy had only two major arms rather than the four it had been thought to have. However, just before Christmas a new study of young stars was published which agreed with the original model. It seems this disagreement between observations using different data might be telling us something about the history of star formation in the arms of the Milky Way.
It’s worth noting that we still don’t know exactly how spiral arms are formed! It seems clear that waves of increased density travel through the disc, bunching up the stars and gas, but what drives these waves and how transient they are remain questions to be answered by continuing research.

